


Earth Day and the Industrial Revolution in 3 Graphs
It's Earth
Day. Or it was three days ago. But what we write is still relevant to the
season. In any event, why would we begin
with a picture of world population growth?
Well, the number of people on Earth should have an obvious connection to
Earth Day. But the key to the immediate connection
we want to highlight is the blue line in the graph showing the beginning of the
Industrial Revolution. A neighbor of
mine, a gentleman who's fairly in-the-know about economic issues, stopped me on
the street the other day to ask if I understood how much difference the
Industrial Revolution made to the world's population. He had just learned this, he explained, in an
online course he had taken, and he was stunned.
So I figure if Steve is stunned, maybe some of you are too. So here's some of the story and why we pay
particular attention on Earth Day. It's
not just the numbers of people, but their standards of living that matter.

The key is
the bend in line. The world's
population was basically flat from the year 1 A.D. to 500 A.D. at about 200
million people; estimates show that by 1000 A.D., it was still no more than
250-300 million. Population reached
about 500 million by 1500 and 1 billion in 1800. Now, just 215 years later, there are about
7.2 billion people. The addition of the
last half of that, 3.6 billion, has taken only 45 years. So clearly some very dramatic things happened
around and after 1800.
We often
think of the Industrial Revolution in terms of the cotton gin and other
machinery, but advances in health care and public facilities are also
important. As examples, Edward Jenner's
small pox vaccine came in 1798. John
Wilkinson, an Englishman, developed the iron pipe that made a new water supply
system in Paris in 1786. John Snow realized in 1854 that contaminated
water could contribute to the spread of cholera. Before this period, life expectancy at birth
hovered around 24 years in the medieval period and got to 35 in England by the
mid-18th Century. By 1900, it
reached the late-40s and was about 80 years in 2010. In other words, death rates declined
markedly. This is so all over the world.
At the same
time, birth rates have also declined.
This latter factor has been pronounced enough that population growth
rates have actually moderated in recent decades. Big as the numbers are, they are no longer
accelerating.
Robert
Lucas, a consulting economist to the Minneapolis Federal Reserve Bank, has
written about these birth and death rate trends. As the Industrial Revolution took place,
along with accompanying gains in agricultural output and the improvements to
health, population did expand dramatically.
The gains in production supported the population growth. Thomas Malthus and other economists of his
day – around 1800 – began to fear that this population growth trend would
consume much of the earth's resources, leading to increased poverty. While there is quite justified concern over
that eventuality, Lucas offers some mitigating notions.
At the
outset of the industrial and agricultural revolutions during the 18th
Century, most of society was agricultural, and as farmers obtained larger
yields for their crops and had healthier animals, they used their increased
income to enlarge their families, so they could produce bigger crops still. Living standards – income per person – thus
didn't change much at first. From 1700
to 1820, world GDP firmed from 0.2% growth per year to about 0.5%. But population had almost the same movement,
so each person was associated with about $665 worth of output in 1820, only mildly
larger than the $596 in 1600.
But starting
around 1820, that relationship shifted.
Those health improvements we mentioned before, clean water and similar improvements
to sewage disposal, made conditions much better in cities and people began
moving to them and doing more industrial work.
This coincided with diminishing birth rates, enough so that total production
gains were associated with more production per person; by 1900, that had nearly
doubled to $1,260. By 2008, the latest
year for which we have this specific calculation, world output per person was
just over $7,600, as seen here.

We're
writing about all this because it's Earth Day.
What is the connection? As the
line in the above graph was moving definitively higher in the early 1960s, a
marine biologist named Rachel Carson published Silent Spring, a book that grabbed everyone's attention about how
more people were using more of the earth's resources, much of that in an
ironically unhealthy way. For the first
time, many people came to understand that they could not just plow ahead
unconcerned about what they were doing to the earth and its environment. Would this new realization slow growth?
It took some
time, but progress in making the right use of the earth is taking place. Robert Lucas, in the material we reference
here, counters some environmental naysayers' arguments by highlighting the role
of technology. He points out that we
should use a theory of economic growth that embodies not just numbers of people
and amounts of consumption, but the application of technology, ingenuity and
adaptability.
This notion
prompted us to check out the amount of energy used in producing today's GDP compared
to some historical period. If GDP growth
just uses more and more energy resources, then the naysayers will be right;
succeeding generations of people will indeed be less well off because pure air,
clean water and all kinds of material resources will be scarcer for everyone.
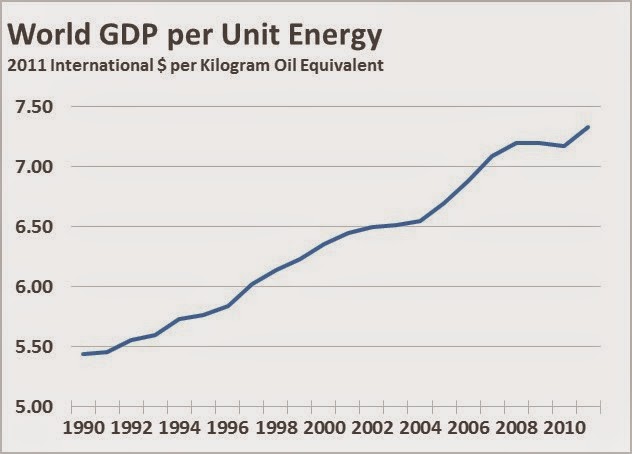
What we
found with some brief searching, is just 20 years' worth of information on
this. But it tells a positive, hopeful
story. Data from the World Bank show
that a fixed unit of energy would yield $5.40 of world GDP in 1990. By 2010, the same amount of energy made $7.20
of GDP.
Further, in
1990, each dollar of GDP was associated with 0.5 kilogram of carbon emissions,
but in 2010, this had fallen to 0.4 kilogram.
Energy use per person has increased for the world as a whole, but this
is happening in middle income regions in Asia, the Middle East and northern
Africa, not in high income regions. In
fact, in many places per capita energy use has gone down; in the U.S., for
example, each person used 7,700 kilograms of energy in 1990, but just over
7,000 kilograms in 2011.
So perhaps Lucas
is correct. If we know and understand a
situation, we can quite probably find ways to deal with it. Thus, growth can continue to the extent that
we become more efficient in using energy, and we can even develop new energy
sources and/or improve the way we manage current sources. We can further reduce pollution without
severely restricting our general ways of life.
This isn't automatic, and we have to be mindful and deliberate in our
efforts, but we have a good shot at continuing to improve our lives and the
life of the Earth itself.
--------------------------------
Sources:
Robert
Lucas. "The Industrial Revolution:
Past and Future." Federal Reserve Bank of Minneapolis, Annual Report
Essay, 2003 Annual Report, published May 1, 2004. https://www.minneapolisfed.org/publications/annual-reports/the-industrial-revolution-past-and-future. Accessed April 24, 2015.
Eric
McLamb. "The Ecological Impact of
the Industrial Revolution". Ecology
Global Network. September 18, 2011. http://www.ecology.com/2011/09/18/ecological-impact-industrial-revolution. Accessed April 24, 2015. Also see McLamb's Earth Day commentary from
2014: "Earth Day and the Human Revolution" http://www.ecology.com/2014/04/22/earth-day-human-revolution/. Accessed April 24, 2015.
Long-term
historical data on population and world GDP are based on Angus Maddison, The
World Economy: A Millennial Perspective.
Paris, France: Organisation for Economic Co-operation and Development. 2001 and 2006. http://www.oecd-ilibrary.org/development/the-world-economy_9789264022621-en. A pdf may be purchased or the book may be
read in an e-book format on that site.
Barnes & Noble and Amazon also have it available.
Maddison was
professor at the University of Groningen from 1978 to 1997 and a founder of the
Groningen Growth and Development Centre. He passed away in 2010. His data are recognized as the primary
compilation of long-term world-wide GDP and other economic and demographic
indicators; they are now maintained and made available in spreadsheets on a
site managed by his colleagues at that research center http://www.ggdc.net/maddison/oriindex.htm.
Data on the
relationship of energy to GDP, energy use per person and carbon emissions come
from the World Bank's World Development Indicators. The 2015 edition of these was published just
on April 14, 2015, and includes these energy data through 2011. See http://wdi.worldbank.org/table/3.6
"Energy production and use" and http://wdi.worldbank.org/table/3.8
"Energy dependency, efficiency and carbon dioxide emissions". Accessed April 24, 2015.
Labels: Economy, Environment, Science and Evolution, World
posted by Carol S. | 4/25/2015 03:42:00 PM
![]()
![]()


0 Comments:
Post a Comment
<< Home